
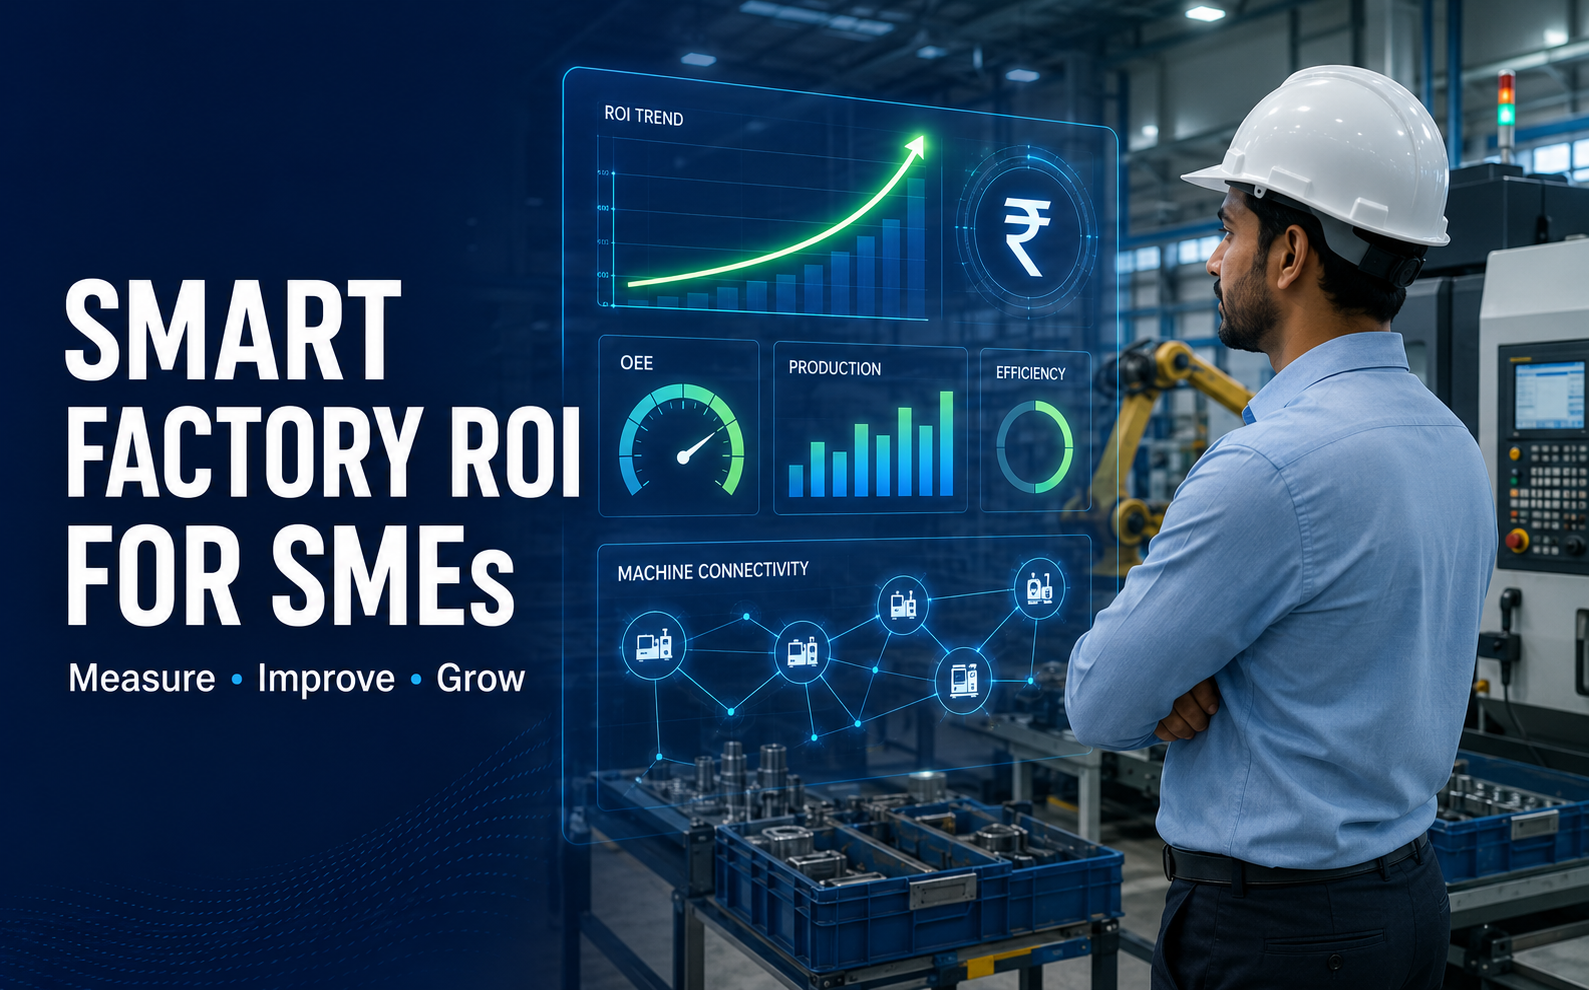
For a small or medium manufacturing company, a Smart Factory project should not begin with sensors or dashboards. It should begin with a measurable business problem such as unplanned machine stoppage, low utilization, excess rejection, high energy consumption or delayed production reporting.
Return on investment helps management compare the total project cost with the financial value created. A credible ROI calculation gives SME owners confidence to approve a pilot, prioritize machines and set measurable targets.
What Does Smart Factory ROI Mean?
Smart Factory ROI measures the financial return generated through digital production monitoring, machine connectivity, real-time alerts, OEE analysis, traceability, energy monitoring and data-driven process improvement.
1. Calculate the Total Smart Factory Investment
The investment must include more than software licensing. List every one-time and recurring cost required to make the system operational.
Typical one-time costs
- IoT gateways, sensors, PLC connectors and edge devices
- Software configuration and dashboard development
- Machine integration and network preparation
- Data mapping, testing and commissioning
- User training and change-management support
Typical recurring costs
- Annual or monthly software subscription
- Cloud hosting, data storage and connectivity
- Technical support and system maintenance
- Internal administration and improvement activities
2. Identify Measurable Annual Benefits
Benefits should be calculated from the factory's existing performance baseline. Wherever possible, use at least three months of historical production data.
Reduced unplanned downtime
Real-time alerts, downtime reason tracking and maintenance trends can help reduce stoppages and prevent repeat failures.
Higher productivity and OEE
Improved availability, performance and quality can increase output without immediately purchasing another machine.
Lower rejection and rework
Process monitoring can help teams detect abnormal cycle times, parameter deviations and recurring quality problems.
Energy and reporting savings
Energy dashboards can expose idle power consumption and inefficient equipment. Automated production reports can also reduce manual data entry and reporting time.
3. Worked ROI Example for a Manufacturing SME
Consider a component manufacturer connecting ten production machines. The following values are illustrative and should be replaced with actual factory data.
Initial investment
| Investment item | Amount |
|---|---|
| Machine connectivity, gateways and sensors | ₹4,00,000 |
| Software setup and dashboard configuration | ₹2,50,000 |
| Integration, testing and training | ₹1,50,000 |
| Total initial investment | ₹8,00,000 |
Estimated annual financial benefits
| Benefit area | Annual value |
|---|---|
| Reduced unplanned downtime | ₹4,80,000 |
| Productivity improvement | ₹3,60,000 |
| Reduction in rejection and rework | ₹2,40,000 |
| Energy and reporting savings | ₹1,20,000 |
| Total gross annual benefit | ₹12,00,000 |
| Annual software, cloud and support cost | ₹2,00,000 |
| Net annual benefit | ₹10,00,000 |
ROI calculation
4. Use Multiple ROI Scenarios
A single estimate can create false confidence. Manufacturing SMEs should calculate conservative, expected and optimistic scenarios.
| Scenario | Net benefit | ROI | Payback |
|---|---|---|---|
| Conservative | ₹6,00,000 | 75% | 16 months |
| Expected | ₹10,00,000 | 125% | 9.6 months |
| Optimistic | ₹14,00,000 | 175% | 6.9 months |
5. Smart Factory KPIs to Monitor
- OEE: Availability × Performance × Quality
- Unplanned downtime: Hours by machine and reason
- Mean time to repair: Time required to restore production
- Cycle-time variance: Actual versus standard cycle time
- Rejection rate: Quality losses by product or process
- Energy per good unit: Energy used for saleable output
- Schedule adherence: Planned versus actual production
Low-Risk Implementation Roadmap for SMEs
- Establish the baseline: Record current downtime, OEE, output, rejection and energy performance.
- Select a focused pilot: Begin with three to five critical machines or one production line.
- Set financial targets: Connect each KPI target to a realistic rupee value.
- Run the pilot: Validate production data and train users to record downtime reasons correctly.
- Review after 60–90 days: Compare actual results with baseline performance.
- Scale based on evidence: Extend the system only after confirming value and user adoption.
Common ROI Calculation Mistakes
- Using machine revenue instead of contribution margin
- Counting extra capacity when there is no additional demand
- Ignoring recurring software and support expenses
- Counting the same benefit under multiple categories
- Assuming every theoretical improvement will be achieved
- Ignoring employee training and system adoption
- Scaling across the plant before completing a pilot
Conclusion
A Smart Factory project becomes financially convincing when the company connects operational losses to measurable rupee values. For most SMEs, the right starting point is a focused pilot supported by baseline data, realistic assumptions and a clear payback target.
With appropriate machine selection, KPIs and implementation scope, real-time production monitoring can help SMEs reduce downtime, improve OEE, control rejection and make faster, data-driven decisions.
Build a Smart Factory ROI Case for Your Plant
Rheologist Gaze & Solutions supports manufacturing SMEs with plant assessment, machine connectivity, production monitoring, KPI dashboards, training and phased Smart Factory implementation.
Request a ConsultationPhone: +91 89394 50666 | Email: info@rgees.in
Disclaimer: The financial values shown above are illustrative. Actual ROI depends on existing production losses, machine utilization, contribution margins, implementation scope and the operational improvements achieved.